Resources
 Part of the Oxford Instruments Group
Expand
Collapse
Part of the Oxford Instruments Group
Fusion research has entered a new era by the decision to built ITER, the world first reactor to demonstrate a 10 fold power multiplication based on the process of nuclear fusion. With this big international, multi-billion euro project, the requirements on the diagnostic tools change considerable: from studying offline the physics parameters of the hot (> 100 million degree) plasma, the focus will shift more towards controlling this hot plasma: keeping the temperature of output power constant in time. A real-time measurement and analysis of the plasma parameters like temperature or density is needed. For one such diagnostic technique, use was made of a set of three Andor cameras (two DC152 QC-FI sCMOS camera and one iXon3 DU888 DC-EX EMCCD camera). In this note, we will introduce the background, the operating principle and the results obtained in a pilot study performed on an experimental fusion device (the tokamak ASDEX-UG in Germany).
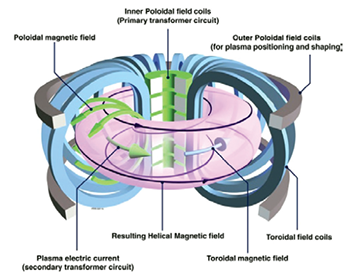
Figure 1: Principle of a tokamak fusion reactor.
The easiest fusion reaction possible is the deuterium tritium reaction, in which those two nuclei combine to form a helium nucleus and a neutron. Since a high energy is required for this reaction to overcome the Coulomb repulsion, the deuterium tritium plasma has to be heated to the order of 100 million degree. Such a plasma is confined by magnetic fields in a so-called tokamak, see Figure 1. Once the conditions for an appreciable fusion power production (which depends strongly on the ion temperature) are met, one of the issues is in the helium. Since this reaction product is charged, it will stay confined in the plasma (in contrast to the neutron). If its density gets too high it might choke the fusion burn. This poses a diagnostic challenge: is it possible to measure in real-time the helium density in the core of this plasma and if possible also the ion temperature (since this determines the fusion yield)?
The common method for plasmas to obtain temperatures and densities is to make use of the optical emission of the line radiation of excited atoms or ions. The spectral width of one such line is governed by the Doppler effect and thus provides a measurement of the velocity distribution, which effectively represents the temperature. The total intensity of this line is proportional to the density of the ions. However, in the hot core of a fusion plasma, all ions are fully ionized, and no line radiation will be emitted, making it impossible for a passive spectroscopic technique to obtain the temperature and density. So in a fusion reactor only the cold edge emits light and the centre is not accessible for spectroscopic investigations, see Figure 2.
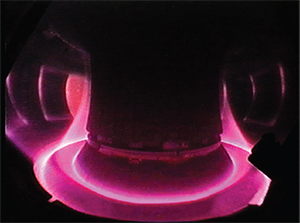
Figure 2: Picture of visible light emission in the ASDEX--UG tokamak. This radiation only originate from the cold edge of the plasma. No light is emitted from the hot core.
By actively injecting neutral deuterium atoms into the hot plasma, there is a certain probability that the helium ions pick up an electron from this injected atom and thus is able to radiate line emission in the visible wavelength region. A spectroscopic measurement of this light allows to determine the helium density (from the intensity) and the ion temperature (from the width of this line). This technique is referred to as Charge Exchange Recombination Spectroscopy, CXRS in short.
To design a system, based on the CXRS principle, several requirements have to be taken into account: the signal level is very low in comparison to the edge emission and the continuum radiation from the bremsstrahlung.
Therefore a high etendue system with a high transmission factor is needed in combination with sensitive detector. Moreover the spectral resolution should be sufficient to discriminate between the edge Figure 1: Principle of a tokamak fusion reactor (www.EFDA.org). Figure 2: Picture of visible light emission in the ASDEX--UG tokamak. This radiation only originate from the cold edge of the plasma. No light is emitted from the hot core. (www.EFDA.org). Measuring ion temperatures and helium densities in the hot core of a nuclear fusion reactor using sCMOS and EMCCD cameras emission and the core emission, and to make it possible to determine the width (so the ion temperature) with sufficient accuracy. The time scales on which these measurements have to be taken are determined by the characteristics of the plasma and the energy flow in there. For present day tokamaks and also for the test reactor ITER, a time resolution of 10 ms is required for a full profile measurement. Finally, it should be noted that the emitted CXRS intensity is governed by the density of the injected neutral beam and the density of the helium ions. So a determination of the beam density is required to be able to extract the helium density from the measured spectra.
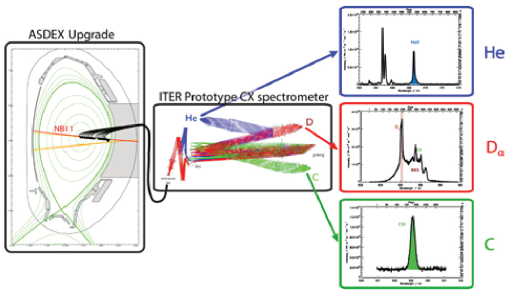
Figure 3: Sketch of the CXRS system. On the left hand the poloidal cross section of the ASDEX--Upgrade tokamak, indicating the trajectory of the neutral beam particles (NBI1). An optical system will image the light from the intersection of the neutral beam and the line of sights (black lines) onto a high etendue spectrometer. This spectrometer, equipped with three Andor cameras consists of three wavelength band and is thus able to record the spectra of three different ions: the helium ions (He), the emission from the deuterium beam itself (Balmer--α: D α) and the carbon ions (C which provides an independent measurement of the ion temperature). Since about 20 fibers from different intersections with the neutral beam) are imaged onto the spectrometer, a complete radial profile of the ion temperature and the helium density can be recorded (From: A. Kappatou)
Based on the above consideration, on ASDEX upgrade a CXRS system has been designed and tested with the following characteristics (see Fig 3):
References
© Oxford Instruments 2024