Resources
 Part of the Oxford Instruments Group
Expand
Collapse
Part of the Oxford Instruments Group
Ultra-sensitive detection/screening of antibodies has been recently demonstrated using an immunodiagnostic technique applied to nanocrystal encoded microbeads. Work reported by Alyona Sukhanova et.al.[1] in Nano Letters, shows the application of nanocrystal encoded microbeads in flow cytometry assays for investigation of multiplexed antibody profiling. They demonstrate how their design of their assay can distinguish between different antibody-antigen configurations. Their results are particularly relevant to the development of clinical diagnostics for the early detection of autoimmune diseases.
As part of their work, they use fluorescence spectroscopy – in particular the use of fluorescence resonance energy transfer (FRET) – to validate their ‘proof-of-principle’ approach and demonstrate the possibility of ultrasensitive screening of auto-antibodies; FRET spectroscopy was carried out on single microbeads to estimate the limit of detection of such auto-antibodies: the latter are markers of systemic sclerosis. The spectroscopic data was acquired with a laser scanning confocal microscope coupled to a spectrograph with a high-sensitivity EMCCD camera.
In the ever expanding areas of proteomics and genomics, there is a continual drive by researchers to both extend the limits of traditional methods and also develop new techniques. Work recently reported in Nano Letters[1] by Alyona Sukhanova et.al. and carried out by Prof. Nabiev′s group at Université de Reims Champagne-Ardenne, France, and Prof. Feldmann′s group at Ludwig-Maxilmilians-Univerität München, Germany, is outlined briefly here in this note, with particular reference to their use of FRET spectroscopy with an EMCCD camera to demonstrate a ‘proof-of-principle’ ultra-sensitive screening of auto-antibodies.They describe the use of fluorescence encoded nanocrystals for carrying out multiplexed antibody profiling in flow cytometry with a view to aiding in the diagnosing of autoimmune disease. Sukhanova et al [1] report the first application of nanocrystal encoded micro-beads to clinical proteomics.
Micro-bead based assays using organic dyes as fluorescent tags is a well established method. However, the use of semiconductor nanocrystals, in place of the polymeric beads encoded with organic dyes, with their narrower emission profiles allow for a greater number of unique codes or increased multiplexing capability. They can also offer improved photo-stability and sensitivity to the detection of antigens, as well as offering a higher resistance to photo-bleaching. The emission colour of the fluorescent nanocrystals can be tuned by varying their size and chemical composition. A key feature in the favour of semiconductor nanocrystals, is their broad absorption band spectra, whilst having relatively narrow fluorescence emission spectra. This means a single wavelength far removed from the narrow emission regions of various populations of nanocrystals can be used to excite these different populations and at the same time avoid spectral overlap between the excitation and emission. The result is improved multiplexing capability. Coding refers to this ability to design into the nanocrystals these specific narrow band fluorescence emission regions.
The main type of sample used in their spectroscopic work on single-beads consisted of microbeads encoded with orange emitting nanocrystals, which were coated with a fragment of topoisomerase I (topo I) - a human antibody - and subsequentlyincubated with the anti-topo I specific antibodies. They were then stained with Alexafluor-633 dye-labeled secondary antibodies. With their experimental technique outlined here, the auto-antibody – bead binding interaction could be used to turn the characteristic fluorescence signal from the dye off and on by utilizing the FRET process.
The fluorescence spectroscopic measurements were carried out on single microbeads (diameter of ~3μm). Their experimental setup used a confocal laser scanning optical microscope. In one arrangement, a laser light source of excitation wavelength 532nm and focal spot size of~500nm diameter was used to excite the sample. As an alternative excitation source, a broad band lamp with filter provided excitation of bandwidth 450nm to 500nm.
The sample, consisting of an aqueous suspension of beads dispersed on a microscope slide, was mounted on a piezo controlled stage which allowed for 2D scanning of a 100μm x 100μm region.A 2D fluorescence image was built up using an avalanche photodiode detector (APD). With this image, specific areas could be chosen for further investigation using fluorescence spectroscopy.
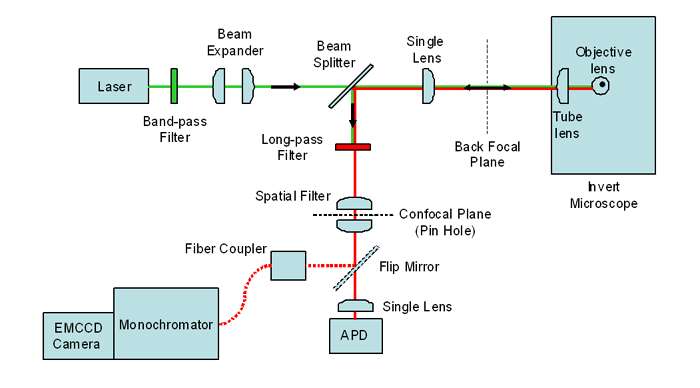
Figure 1: Schematic of Confocal Fluorescence Spectroscopy and Imaging setup (Courtesy of Alpen Bek)
An optical fibre of 50μm core diameter was used to couple the light from the microscope into a 1/3m spectrograph with an EMCCD camera as the detector. The spectrograph, a Shamrock 303i, had a NewtonEM camera attached at the main exit port to capture the spectra. Figure 1 below shows a schematic of their confocal setup for capturing fluorescence images and spectra.
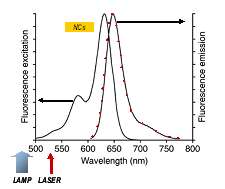
Figure 2: The characteristic absorption and fluorescence emission from Alexafluor 633 labelled antibody as illustrated here for Alexafluor 633 goat anti-mouse IgG antibody (from Invitrogen)
The relative absorption and emission spectra of the Alexafluor-633 dye labeled secondary antibodies are shown in figure 2 (data from Invitrogen). In the design of their experiment, Sukhanova et.al. chose the excitation light sources such that the lamp source (450nm-500nm) lay outside the absorption band of the Alexafluor-633 and therefore couldn′t cause excitation by direct means.On the other hand the laser (532nm) could directly excite the Alexafluor-633 as it overlaps the absorption band.The nanocrystals (NCs) were designed to emit in the orange – in the 550 – 600nm region. Having a broad absorption band, the NCs could be excited by both the lamp and laser.
Where there is overlap of the nanocrystal emission with the dye absorption band, a path is offered for excitation of the dye molecules by transfer of energy from the NCs by the FRET process.This overlap is illustrated in the figure with the orange band labeled NCs. For FRET to occur the donors (NCs) need to be close, on the order of the Förster distance (~ 60Å in this case), to the acceptors (Alexafluor-633 molecules). Thus excitation of the NCs by the lamp source and associated observation of fluorescence from the Alexafluor-633 secondary antibodies can act as an indicator of binding between the topo I antibody coated microbead and the anti-topo I specific antibodies.
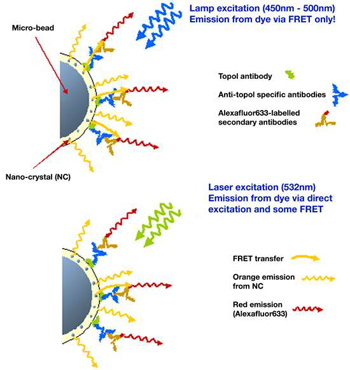
Figure 3: Schematic of fluorescence process on microbead based assay
A schematic of the FRET process is illustrated in figure 3 below. The top diagram in figure 3 shows that when the lamp excitation source (450nm – 500nm) is used,fluorescence resonant energy transfer can occur between the excited nanocrystals and the Alexafluor-633-labelled secondary antibodies.The Alexafluor-633 dye does not absorb light with wavelengths shorter than ~500nm, so direct excitation is not possible with this broad band lamp source. However when the longer wavelength laser source (532nm) is used, bottom diagram,it is possible to excite directly the Alexafluor-633 dye as well as the nanocrystals.The dye emission is dominated by this direct emission source.
Figure 4 shows a series of spectra acquired from several individual microbeads. The lamp source was used to illuminate two types of samples. In 4(A) the emission is shown from NC-encoded topo I-coated microbeads, which had been incubated with anti-topo I specific antibodies and stained with dye labeled secondary antibodies. In 4(B) the samples were prepared in a similar way but without the step involving incubation with anti-topo I antibodies – these acted as control samples.The Alexafluor-633 was present in both samples.
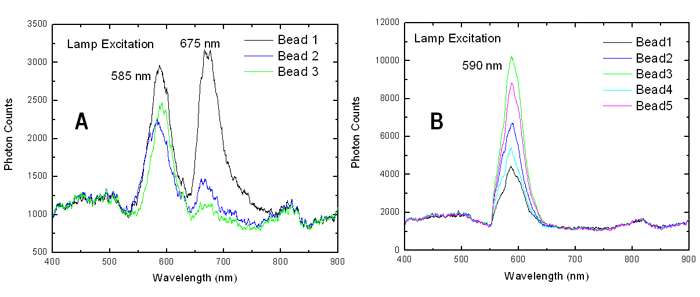
Figure 4: The spectra taken from several beads for two different types of sample. In 4(A) the sample had been prepared including incubation with anti-topo I antibodies as part of the process and 4(B) is a control sample where this step with anti-topo I antibodies was left out (courtesy Alpen Bek).
A strong peak was observed around 675nm for the samples in 4(A) which was absent for the control samples in 4(B). This was indicative of the Alexafluor-633 being bound to the surface of the microbeads for samples in 4(A) but not for the samples in 4(B). FRET was responsible for the excitation and fluorescence emission from the Alexafluor-633 dye in the samples in 4(A); the Alexafluor-633 remained free in solution, hence unbound, for those samples illustrated in 4(B). By deduction this in turn is indicative of the presence or absence of the anti-topo1 anti-bodies.
When samples like those used for 4(A) and 4(B) were illuminated with the laser, fluorescence emission was observed in both the orange and red for both types of sample, with the nanocrystals and Alexafluor-633 being excited directly.The emission from the Alexafluor-663 in these cases came from both bounded and unbounded Alexafluor-633-labelled secondary antibodies. With reference to these latter results and the data illustrated in 4(A), it can be seen that the specific interaction between the microbeads and the auto-antibodies turns the fluorescence signal from the dye off and on, when lamp illumination is used.
As part of their experiments, a control solution of Alexafluor-633-labelled secondary antibody, when illuminated by both sources (lamp and laser), was shown to emit fluorescence only in the case of the laser excitation. This illustrate that the Alexafluor-633 could not be excited directly by the lamp but could be with the laser.
Alyona Sukhanova et.al. have demonstrated the first application of nanocrystal encoded microbeads in clinical proteomics, for multiplexed antibody profiling and diagnostics of autoimmune diseases.Their samples were tested using flow cytometry assays, where they were able to distinguish the presence or absence of auto-antibodies.
Auto-antibodies are markers of diseases developing in healthy individuals and their early detection will be essential for better diagnosis and treatment of autoimmune diseases in the future; hence the main thrust and motivation behind this work.
As part of their ‘proof-of-principle’, they demonstrated ultra-sensitive measurements of the FRET process in their assay design on single microbeads with confocal fluorescence spectroscopy using EMCCD technology. With the enhanced S/N offered by the NewtonEM, they were able to measure down to fewer than 30 dye-labeled antibodies (bound to the surface of the microbeads).
Appreciation is gratefully extended to the authors of the paper reviewed in this case study, in particular to Dr Alpen Bek and Dr Andrey Rogach.
© Oxford Instruments 2024
