iDus 401 CCD
View Product
 Part of the Oxford Instruments Group
Raman Spectroscopy is an optical technique that is especially suited to in-situ reaction monitoring in chemical synthesis. However, when low concentrations of the reactants are involved it is no longer feasible, due to the intrinsic weakness of the Raman scattering of the reagents relative to the solvent. To circumvent this problem of sensitivity one can obtain an enhanced Raman signal of specific reaction components using techniques such as Surface Enhanced and Resonance Raman Spectroscopy. The use of Ultraviolet-Resonance Raman (UV-RR) is illustrated here by work carried out by a group of researchers in the Netherlands at the University of Groningen. Their aim was to demonstrate the feasibility of using UV-RR as an online reaction monitoring technique for low temperature catalytic oxidation of organic substrates (e.g., bleaching) in aqueous environments. An important industrial application of the use of low temperature catalysts is the bleaching of cotton fabrics.
Abdolahzadeh et al used the epoxidation of alkenes, catalysed by a manganese complex, as a proof of concept model reaction. Manganese complexes of the ligand 1,4,7-trimethyl-1,4,7- triazacyclononane (TMTACN) were identified as highly effective catalysts for low temperature bleaching in the early nineties. However, due to the low substrate solubility in aqueous conditions one is generally dealing with low substrate concentrations (<10 mM). A key challenge in reaction monitoring in such conditions is having the ‘sensitivity’ to work with such low concentrations.
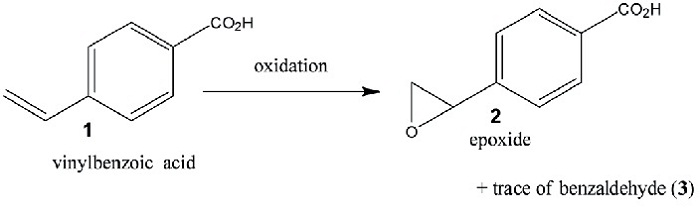
Figure 1: Schematic of the model reaction for demonstrating the technique. 4-Vinyl-benzoic acid is oxidised in water with H2O2 to form the reaction products, an epoxide and traces of the corresponding carboxybenzaldehyde. A manganese complex was used as the catalyst.
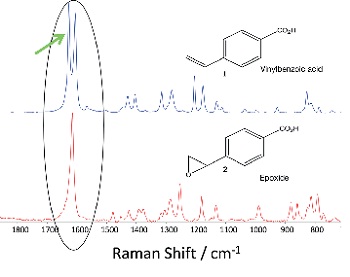
Figure 2: Comparison of the Raman ‘fingerprints’ for the 4-vinyl-benzoic acid and the epoxide product. Spectra were taken on solid state samples using an excitation wavelength of 785 nm. The key feature used for monitoring the reaction kinetics is highlighted at a Raman band around ~ 1631 cm-1.
A schematic of the chemical reaction used for the demonstration is shown in Figure 1. It illustrates the oxidation of 4-vinylbenzoic acid in water with H2O2 catalysed by the manganese complex. The reaction progress was monitored by recording the resonance Raman spectrum and monitoring the change in intensity of selected spectral features relative to an internal standard (Na2SO4).
The main components used in the experimental setup are illustrated in figure 3. The sample solution of 1 mM 4-vinyl-benzoic acid dissolved in water upon addition of H2O2 and an internal standard (0.05 M Na2SO4) was held in a quartz cuvette (1 cm pathlength 3 mL volume) and at time zero the manganese catalyst (final concentration 0.01 mM) was added. The reaction was carried out at 18°C. An excitation wavelength of 266 nm was chosen as it coincides with the strong UV absorption bands of the 4-vinyl-benzoic acid and (to a lesser extent) the epoxide and aldehyde products (see Figure 4 & 5), which facilitates resonance enhancement of the Raman scattering from the reactant and products.
266 nm laser light, the fourth harmonic of an Innolas Spitlight200 Nd:YAG ns-pulsed laser (10 Hz, 4-5 ns pulse width), was delivered using dichroic mirrors (to remove residual 532 nm light) and quartz prisms, providing an average power at sample of 1-2 mW. A 180° backscattering geometry was employed with quartz planoconfocal lenses being used for focusing and collimating (see optical table in Figure 3).
The collected scattering was focused into a spectrograph (Shamrock 303i, 300 nm blaze, 2400 l/mm grating) and onto a UV-sensitive iDus CCD detector (DU420A-BU2). The BU2 sensor is a back-thinned sensor with AR coating optimised for the deeper UV circa 250 nm, making it ideal for this spectral region. A long pass filter (266 nm RazorEdge® ultrasteep long-pass edge filter from Semrock) was placed just in front of the spectrograph entrance slit to prevent the Rayleigh scattered light from entering the spectrograph. Raman spectra with typical acquisitions settings of 60 accumulations of 2s exposure were captured at intervals of 15 minutes.
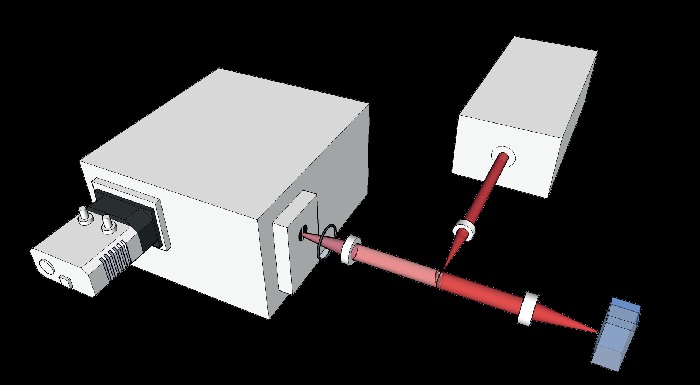
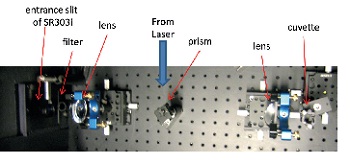
Figure 3: Schematic of the experimental setup in the back-scattering configuration. A picture of the optical layout is included below.
Spectra taken on pure samples of 4-vinyl-benzoic acid and the epoxide and aldehyde products – see figures 2 and 5 – show the main Raman feature used to monitor the reaction progress at a Raman shift of 1631 cm-1. Solid state samples excited at 785 nm produced the spectra in figure 3 whilst solutions (1 mM) were used for those of Figure 6.
The corresponding UV absorption spectra are shown in Figure 4.
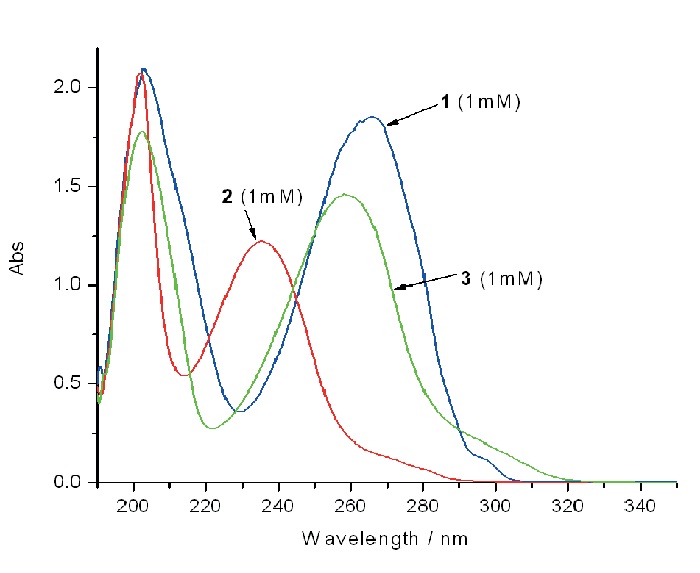
Figure 4:The corresponding UV/Vis absorption spectra are shown in B.
A series of spectra taken at different times under the real experimental conditions, with concentrations of 1 mM, are shown in figure 5. The intensity of the Raman band at 1631 cm-1 can be seen to fall as the reaction progresses. Figure 6 shows the variation of the intensity as a function of time.
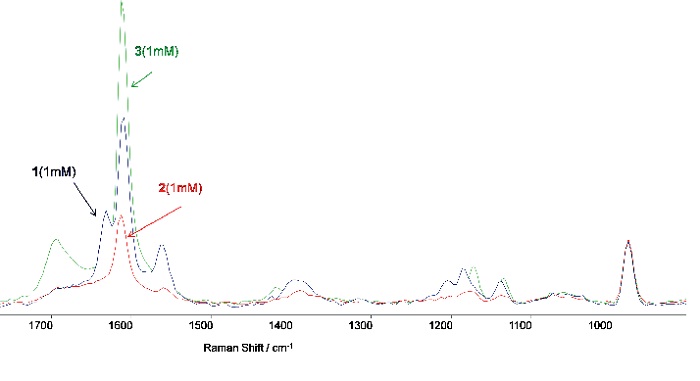
Figure 5: A shows the resonance Raman spectra (in 0.1 M NaHCO3 buffer, pH=8) of pure samples of 4-vinyl-benzoic acid (1, 1 mM), the epoxide product (2, 1 mM) and the carboxy-benzaldehyde (3, 1 mM) product (internal reference Na2SO4 0.25 M).
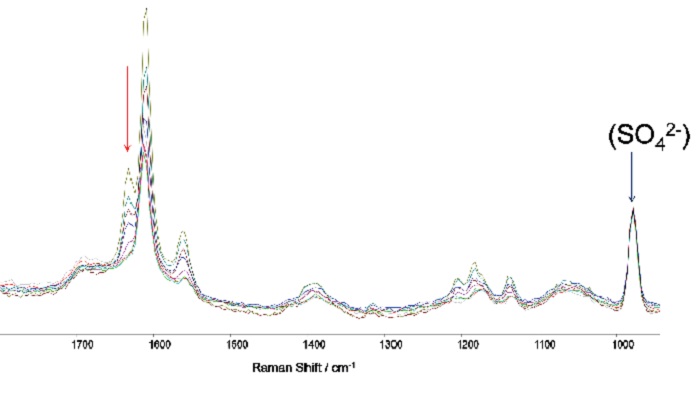
Figure 6a: A series of captured Raman spectra illustrating how the variation in intensity of the feature at 1631 cm-1 facilitates monitoring of the reaction process through time. The standard Raman band from Na2SO4 (0.05 M) is evident on the right.
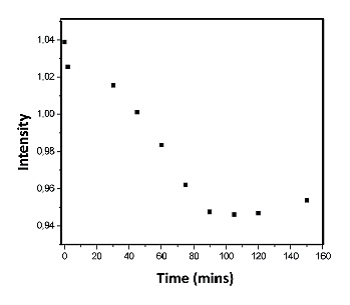
Figure 6b: Variation with time of the intensity of the Raman band at 1631 cm-1.
The results in Figure 6b demonstrate the potential of UV-Resonance Raman Spectroscopy as a real-time on-line reaction monitoring technique, particularly when working with low concentrations of reactants (<1 mM). The optimization and enhancement of the signal is important for it to be useful a screening technique for low concentration species. Resonance Raman, efficient light collection and sensitive multichannel detectors in the UV - (as with the BU2 sensor) are key.
© Oxford Instruments 2024