Resources
 Part of the Oxford Instruments Group
Expand
Collapse
Part of the Oxford Instruments Group
The inherent design of a flow cytometer gives a unique advantage in multiparameter measurements on single particles, where each fluorphore is matched to a unique detector. However, the long standing goal of collecting complete emission spectra of spectrally labeled particles has remained elusive. In recent years Professor John Nolan and his group at the La Jolla Bioengineering Institute in San Diego have made significant strides toward this goal by coupling high-throughput dispersive spectrometers to standard design flow cytometers.
Introduction
The Nolan group has developed a Spectral Flow Cytometer (SFC) capable of acquiring complete emission spectra of single particles by substituting a dispersive optic spectrometer in place of the traditional mirrors, filters and photomultipliers (PMTs) on a conventional flow cytometer. A key component of the SFC is a high speed, multi-element CCD detector, which enables the collection of a complete high resolution spectrum during the short transit time of an individual cell through the instrument probe volume. The measurement is enhanced over traditional flow cytometers by the high sensitivity of these detectors, especially in the near IR spectral region, and by the on-chip binning capability which allow for signal enhancement, while minimizing noise. The coupling of the highly sensitive detector with a high throughput imaging spectrograph allows for a measurement time approaching 200 events per second.
Setup
The Nolan group’s first generation SFC featured a collection and detection system capable of distinguishing particles using Surface Enhanced Raman Spectroscopy (SERS). [1] Raman spectroscopy is well suited to multi-parameter measurements due to the availability of narrow spectral features in a relatively small spectral window. The Raman flow cytometry instrument has been shown capable of characterizing the Raman active population of bulk nanoparticle preparations at a single nanoparticle level. [2] This allowed for the optimization of the SERS tagged nanoparticle synthesis to produce bulk preparations with a large percentage of nanoparticles featuring high Raman activity. More recently, the system has been used to distinguish populations of cells labeled with two different SERS tagged antibodies. [3] The Raman spectral flow cytometer is well suited to address many of the common applications in flow cytometry, however fluorescent tags are most often used as a labeling agent. Therefore a system capable of distinguishing the relatively broad emission of visible and near-infrared emission probes was necessary.
To this end, the Nolan group has developed two second generation SFCs (Figure 1). [4] The first is configured for visible fluorescence detection and is based on an optical bench from a commercially available flow cytometer (FACSCanto, BD Biosciences). Excitation by either a 488 nm or 405 nm laser is directed to the flow cell by the flow cytometer beam steering and shaping optics. The spectral detection system consists of a fiber-coupled HoloSpec imaging spectrograph with either 457 nm edge filter or a 488 nm notch filter and a broadband volume phase holographic grating coupled to a Newton DU970-UVB EMCCD detector. The second system is similar to the Raman flow cytometer previously described [1] but is configured for NIR fluorescence and uses a 785 nm diode laser for excitation. The emitted light is fiber coupled to a HoloSpec imaging spectrograph with a 785 nm edge filter and a narrow band volume phase holographic grating which uses a Newton DU920NBRDD for detection. On both systems spectral detection was triggered using the forward angle light scattering (FALS) detection system of the respective optical bench.
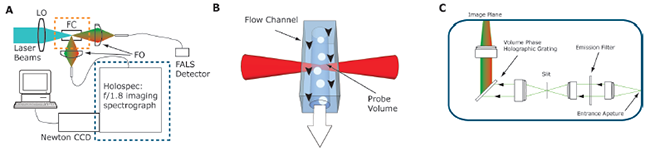
Figure 1: The Spectral Flow Cytometer. A) Schematic of the SFC: 405, 488, or 785 nm laser emission is directed at the flow chamber (FC) by laser focusing and shaping optics (LO). Fluorescence is collected by fiber coupling optics (FO) and directed at either the FALS detector, a traditional PMT based detector (not shown) or a dispersive imaging spectrograph. The dispersed spectrum is detected by either a Newton EMCCD or a Newton BRDD CCD camera. B) Sample is hydrodynamically focused to flow as a straight line through the focus laser excitation beam. C) Schematic of the HoloSpec spectrograph: fiber coupled light is collimated by a lens before being passed through a notch or edge filter, the filtered light is focused through a slit and recollimated before being directed on to a volume phase holographic grating. The spectrally dispersed light is then focused onto the camera.
The use of a dispersive optic based, high throughput spectrograph with a highly sensitive CCD detector offers increased multiplexing capability over conventional flow cytometers. But, in order to realize the benefit of the increased data into multi-parameter cell and particle based applications, spectral unmixing data analysis routines are required. The Nolan group applied two spectral unmixing approaches to the fluorescence spectral flow cytometry data. The first replicates a traditional flow cytometer with optical filters for spectral separation. Digital filters are applied in post-acquisition analysis in order to separate the different spectral components of the total signal. This offers a huge advantage over the traditional method since the number of filters is limited only by the number of spectral data points and each filter can be tuned to exactly match the emission spectra of the fluorescence dyes. Even so, the power of this spectral filter analysis is limited, since the broad spectral features typical of fluorescent dyes ensure a significant amount of cross talk between adjacent filters for dyes with similar emission spectra. The second approach uses a custom nonnegative classical least squares (CLS) routine. This approach assumes that the detected signal from a mixture of fluorescent dyes is a linear combination of the individual spectra of the components. Using this approach, spectral unmixing can clearly identify fluorescent tags even when a high degree of spectral overlap is present.
Results and Discussion
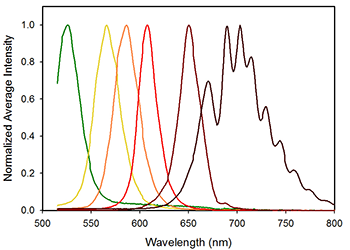
Figure 2: Average spectra of single beads stained with following Qdots: QD525, QD565, QD585, QD605, QD655, and QD705. The average fluorescence intensity has be normalized to average peak intensity of each individual Qdot.
In order to characterize the ability of the SFC to distinguish particles with fluorescent labels, the Nolan team measured microspheres labeled with one of six different quantum dots using the instrument optimized for visible detection, (Figure 2). Using the custom CLS routines, the spectral flow cytometer could not only uniquely identify the label on each microsphere but could determine the amount of each component present. Additionally the spectral mixing routine can account for differences in the absolute brightness of the six different tags, thereby providing the basis for quantitative fluorescently labeled antibody measurements. Next, the team measured mixture of two, three, four, five and all six of the quantum dot labeled microspheres and successfully identified each component and the relative abundance of all 5 mixtures. Finally, the technique was applied to a common flow cytometry application, the analysis of PBMCs stained with canonical surface markers used in lymphocyte subsetting. The spectral flow cytometer with CLS unmixing was able to distinguish CD14+ monocytes and CD3+ T cells as well as the CD4 and CD8 positive subsets demonstrating the instruments capability in “real-world” applications.
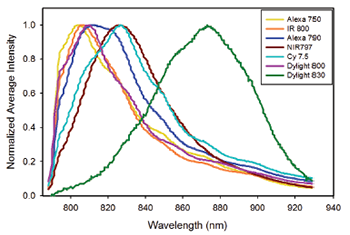
Figure 3: Average spectra of single beads stained with the following near infrared fluorophores: Alexa 750, IRDye800, DyLight 800, Cy7.5, The average fluorescence intensity has been normalized to the average peak intensity of each individual Qdot.
Traditional flow cytometers struggle with spectral detection in the red and near-infrared spectral regions primarily due to the rather poor performance of PMT’s (Quantum Efficiency = 2-8%) in this region. The use of a back-illuminated deep depletion (BRDD) detector on a dispersive spectrometer will allow the SFC to take advantage of the increasing availability of fluorescent dyes with emission in this spectral window. In order to probe the possibilities of near-infrared fluorescence applications in spectral flow cytometry, the Nolan group characterized seven different fluorescently labeled microspheres with emission in the NIR. Of the seven dyes tested, three (Alexa 750, Cy7.5, and DyLight 830) gave spectra with enough distinction to allow for unique determination with CLS unmixing, (Figure 3). The results are indicative of a promising future for spectral flow cytometry in near infrared spectral region, with dyes already available commercially. The increase in development of bright dyes with far-infrared to near-infrared emission should ease the use of this spectral region in flow cytometry applications in the near future.
References
© Oxford Instruments 2024